

The Sugar to Fiber Dietary Ratio
November 23, 2011
-
The low fat diet is actually fueling many diseases
-
Manufactured low fat foods will always contain added sugar and/or salt
-
Why should we care about the sugar to fiber ratio?
-
Two foods can be eaten with the identical calories and grams of sugar, yet they result in very different patterns of energy usage versus fat production
A Critical Measurement
There has been a wealth of study regarding the different components of diet that relate to disease risks. Unfortunately, the commonly used “government type” recommendations have ignored this data. Perhaps the most significant ill-founded recommendation has been the low fat diet. This is universally recommended by primary care physicians, cardiologists and about all other specialists as an answer to everything. In many ways, it is actually fueling many diseases including those that it is intended to prevent or treat such as diabetes and heart disease.
Humans have three primary taste drives or things that stimulate the tongue to tell the brain “good, eat”. These taste drives are the taste of salt, fat and sugar. While there are several other more minor taste drives, these three are the most dominant. Any food that contains one or more of these tastes excites the appetite drive center in the brain. Food that is manipulated to be “low fat” is inherently “low taste” and therefore not desirable. The solution to this for the food industry has been to add one or both of the other primary taste drives to all manufactured low fat foods. They will always contain added sugar and/or salt.
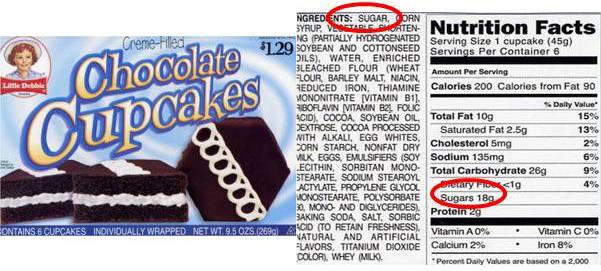
Below is a chocolate cupcake which contains 18 grams of added sugars and less than 1 gram of fiber.
Below is the label from a “healthier alternative”, a cereal bar.
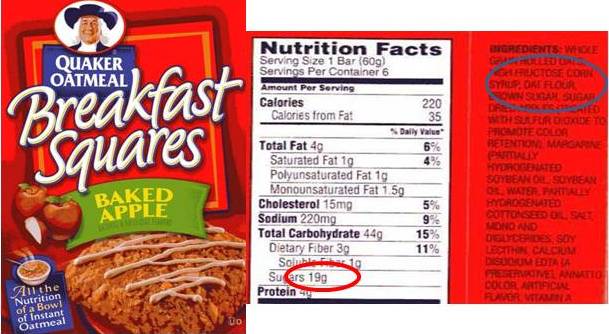
It contains 19 grams of added sugar and again, less than 1 gram of fiber. What most people look at to decide if this is healthy is the grams of fat which is only 4 or 6% of “daily value”. The cupcake would actually be a healthier choice although by no means healthy! While this may seem like an extreme example look at the grams of sugar and fiber on all labels for a week. The typical reaction to this exercise is “they are putting added sugar in everything”!
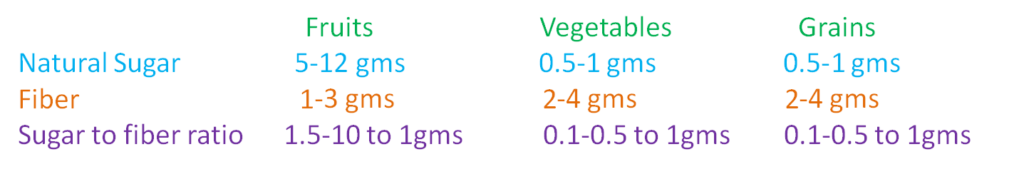
All carbohydrates contain natural sugar, but it is coupled with fiber. The three dominant sources of dietary carbohydrate are fruits, vegetables and grains. To get an idea of what natural sugar and fiber would be seen on the label if it was simply the natural carbohydrate with no added sugar use the table below.
The cupcake has a sugar to fiber ratio of greater than 18 to 1, while the cereal bar is greater than 19 to 1. Both list the fiber as less than one gram so could be 0.1 grams, or it could be 0.5 grams. These are on the order of 30 to 180 times higher than it would be without added sugar and with all of the natural fiber not refined out!
So why should we care about the sugar to fiber ratio? Sugar and fiber have contrasting roles in food. Simple sugars are rapidly absorbed from the digestive tract raising blood sugar abruptly. Fiber slows the absorption of sugars slowing the rate of blood sugar rise. In a state where the body needs a lot of energy quickly, a rapid blood sugar rise will be controlled by rapid cell use of the energy.
However, when overall energy supply is high and utilization is low as with the current US lifestyle and diet, the blood sugar is not needed for energy as fast as it is being absorbed. The blood sugar is then converted to the fat triglyceride in the liver. Once converted these triglycerides are put into the circulation to be delivered to fat tissue for storage. Fat production and storage is as much related to the pace at which sugars are absorbed as it is the overall amount in a given meal. This is where fiber is supposed to come in.
When adequate natural fiber exists in the meal slowing the absorption of sugars, the blood sugar rise is spread over a longer time interval allowing cell energy usage to keep up with energy intake. The net result is that little or none should be converted to fat. Two foods can be eaten with the identical calories and grams of sugar, yet they result in very different patterns of energy usage versus fat production. Slowly absorbed carbohydrate is termed “low glycemic” load, while quickly absorbed carbohydrate is termed “high glycemic load”. The figure below depicts two such blood sugar curves following high and low glycemic load meals of identical carbohydrate grams.
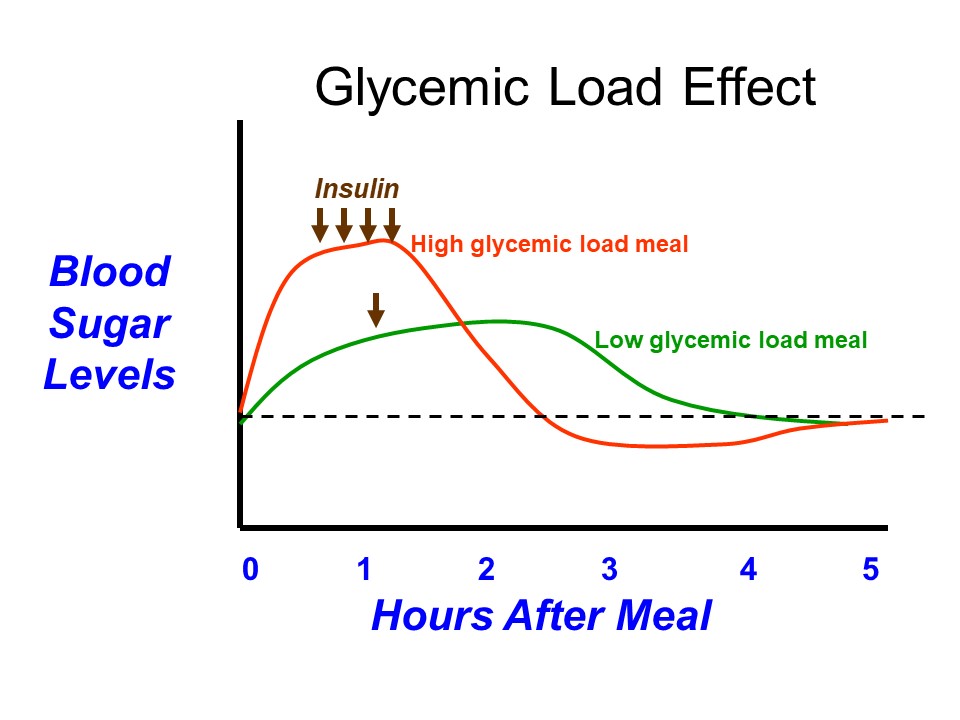
The “0” hour on the horizontal axis represents the time at which one eats. The red curve shows the rise in blood sugar following a high glycemic load meal. The rapid blood sugar rise in the first hour results in a high insulin output to lower blood sugar. As the cell requirements are not this great in the first hour, much of that sugar is sent to the liver and converted to triglyceride for fat storage. This happens aggressively in the presence of high insulin resulting in the blood sugar dropping back to the fasting level in just a little over 2 hours. This triggers hunger and thus a desire to eat again sooner.
The low glycemic load meal can contain the same calories and grams of carbohydrate but in a slowly digestible form. The result is a very gradual blood sugar rise, much lower insulin output and complete use of the sugars for energy rather than for triglyceride production. The gradual absorption of sugars over 4 hours sustaining energy levels suppresses the hunger response for a much longer interval.
Remember, these two meals contain the exact same carbohydrate grams and calories, yet they have much different effects on fat production and hunger response. Given this dynamic, what determines and controls the glycemic load of different carbohydrates is important. The simplest and most useful marker is the sugar to fiber ratio.
Remarkably, a good whole food, low glycemic load diet has about a 1:1 sugar to fiber ratio. The current U.S. average is about 12:1. This is the result of both adding sugar to just about all manufactured foods and the removal of fiber during processing. The 1:1 ratio in a whole food diet comes from about 50 grams of natural sugars per day and about 45 grams of natural fiber. The average daily intake of fiber in the U.S. is about 12-15 grams, while the average sugar intake is 180-220 grams. The U.S. fiber intake doesn’t look that bad in light of the currently recommended amount of 14-15 grams. This is the disconnect between current research and typical policy and recommendations.
In the next blog post I will talk about some of the new research documenting the disease risks associated with the U.S. “diet du jour” of low fat processed foods where the fiber which is reduced by processing and sugar are actually driving risk factors. The very blood lipid abnormalities associated with diabetes and many cases of heart disease such as elevated triglycerides, low HDL or good cholesterol and very small dangerous cholesterol particles are driven by a low fat diet with a high sugar to fiber ratio.
A closing thought is necessary. Why would we be refining fiber out and adding huge amounts of sugar to almost everything when it has important adverse health effects? Sugar drives consumption and fiber drives satiety or the signal “I have had enough”. A high sugar to fiber ratio artificially manipulated in food gets us to consume and therefore buy more food. See, someone is looking out for us!
